Week 8: Statistically Speaking…
Zoey B -
Hello everyone! This week has been all about, you guessed it, statistical data! I spent the beginning of my week working with my advisor to create graphs and charts from my interview data. This allows me to see the general trends of my data and analyze it as a whole. I plan to use these graphs in my final presentation and my article. Below is just one of the charts I made from my data.
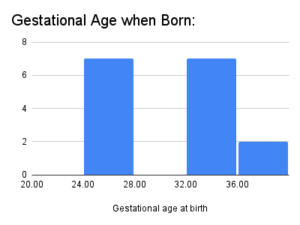
As you can see, the majority of my interviewees had a child born between 24-28 weeks or between 32-36 weeks. My data takes into account all of the families I interviewed as well as the people born premature that I interviewed.
At my internship, I was able to interview an RN that has worked at all levels of N.I.C.U.’s for around 30 years, as well as an NNP (Neonatal Nurse Practitioner) that works in multiple different levels of N.I.C.U.’s including level four (the highest level). Both of these health care professionals have assisted in surgeries of preemies and were able to comment on how the field has changed over time, since they have both been in the field for over 20 years. These were also the last interviews I needed to conduct, so I can begin compiling the data from my interviews with doctors/nurses next week. I also plan to start writing my research paper this next week, as I have completed all of my research.
Comments:
All viewpoints are welcome but profane, threatening, disrespectful, or harassing comments will not be tolerated and are subject to moderation up to, and including, full deletion.