WEEK 3: Getting Started
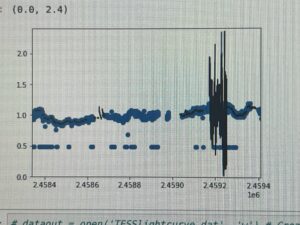
This week, I finally began working on analyzing the data we had gathered. I started with the star HD 269662. I took the code that we already had created and I modified it to fit each piece of data we had gathered about the star. For the most part, it was really easy. I just had to change the number 10 to the number 11 everywhere I saw it, then run the code, make an adjustment or two, change all of the 11s to 12s, and do it again. The goal was to get the data gathered by the Transiting Exoplanets Survey Satellite (TESS) in orbit to match up with the All Sky Automated Survey for SuperNovae (ASAS-SN) on the ground. To do this, I would look at the data gathered on a specific night, then I would change the scale of the graph that the data appeared on to zoom in on the part that the TESS data appeared on. After that, I then changed the TESS data by some constant that would move it up or down and essentially for a best-fit line for the scatterplot formed by the ASAS-SN data. I would then save the results, look at the data for the next night, and repeat this until I did it for every night we had data for this star. In the image below, the blue is the scatterplot of the ASAS-SN data from every night all in one graph and the black is the TESS data from every night all in one graph. As you can see, near the end of the graph, there was a huge spike in the TESS data which means that the star was fluctuating a lot. This is good because this fluctuation is the very thing that we are trying to research.

I also had a day where I was unable to go in person to Embry Riddle. During this time, I continued working on my online Python coding course. This week, I learned how to define functions and then use those functions to do certain things.
