Week 8: Results
Hey everyone! This week we will talk about the survey results!
The survey was open for about a month’s time from November to December 2023, and received 105 responses. About ~62% of the respondents were female and ~38% of respondents were male. About ~77% of responses were from ASU and ~23% were from the Maricopa Community Colleges (MCC) ; the reason for this significant response is that the number students in the ASU classes that this survey was distributed to was significantly larger than the number of students in the MCC classes. Out of all the respondents, ~59% lived in their own houses, ~35% lived in apartments, and ~6% lived in dorms. About ~49% of respondents were college-aged (18-21 years old), ~30% of respondents were in the age of their early career (22-25 years), and ~21% of respondents were in the later-career phase of their life (26+ years).
The survey was structured in a way where 6 factors were tested, and each of the factors had certain questions related to that specific factor (see Figure 1). Each of these questions had a title i.e. the questions about awareness would be titled AW1, AW2, AW3, etc. Each of these questions (expect A2, A3, A4) were compared to a singular question: Are you interested in participating in e-waste recycling in the future? A contingency test was conducted to test the statistical significance of each of these comparisons and the trends the survey results showed. Three of the questions regarding attitude (A2, A3, A4) were qualitative questions not fit for a categorical analysis, and were analyzed separately.
Out of all the contingency tests conducted, only questions AW1, AW2, EC1, and EC2 regarding awareness and environmental concern had trends that are statistically significant with a p-value lower than 0.05. The trends of these questions are shown below in stacked 100% bar graphs.


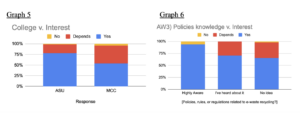
Additionally, there were two questions, the college they attend and AW3, that were statistically significant with a p-value less than 0.10 but greater than 0.05. The trends for these questions are shown below.
This is the data I have received, see you next week for the analysis for this data!
Comments:
All viewpoints are welcome but profane, threatening, disrespectful, or harassing comments will not be tolerated and are subject to moderation up to, and including, full deletion.