Week 4: Data modeling in single-molecule electronics
Rohan V -
Hi all, it’s Rohan! This week in the lab, we are running the mechanically-controlled break junction experiment on a new batch of conjugated organic molecules. These experiments typically take about a week to run, after which point the data output from the experiment needs to be processed. I mentioned last week how because the breaking and reforming of the molecular junction takes place thousands of times, this process of data analysis can be quite tedious. So, today I’ll dive into some of the most common methods used to model and interpret data in the field.
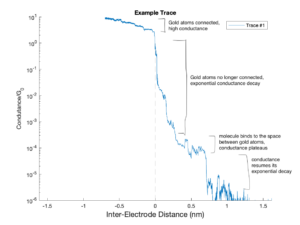
Here is an example graph of how the conductance of the junction evolves as the two gold electrodes are pushed apart. Initially, the conductance is quite high, between 1 and 10 G0, where G0 = 77.48 microsiemens is the unit for measuring conductance. This level of conductance is due to the gold atoms still being connected; the flow of charge through metals results in high conductance.
At 0 nanometers inter-electrode distance, the gold atoms have just been fully ruptured, meaning that there is now air in between them. Thus, conductance starts to exponentially decay. Due to the logarithmic scaling of the y-axis, an exponential decay appears linear on this graph.
Around 10^-4 G0, a molecule binds between the gold electrodes. Consequently, the conductance begins to ‘plateau out’ until the molecule falls out at around 0.75 nm inter-electrode distance. After the molecule falls out of the junction, conductance resumes its exponential decay. The instrumentation of most quantum laboratories cannot measure conductance values below 10^-6 G0, so once the conductance reaches this value, the push rod goes back down, allowing the gold atoms to re-connect and the experiment to be repeated.
These graphs are the universally accepted standard to represent results in single-molecule electronics. However, because the experiments are run thousands of times on a single molecule, it is inefficient to look at every single one of these graphs to gather information about the molecule being analyzed. Next week, I’ll explain some of the methods that researchers use to quickly, yet accurately, gather useful data about the molecule from the aggregate of these results. Hopefully, the experiment that’s currently running will have finished by then, so I’ll be able to apply some of these methods to interpret the output data.
Comments:
All viewpoints are welcome but profane, threatening, disrespectful, or harassing comments will not be tolerated and are subject to moderation up to, and including, full deletion.