The Growth Curve
Bhuvi M -
Hello everyone! This week, I will discuss the growth curve assay I completed to illustrate the difference between GD and OE33.
As a reminder, OE33 is the parental cell line, an esophageal adenocarcinoma isolated from a 73-year-old Caucasian female. This cell line is commercially purchased and utilized at the Norton Thoracic Institute.
GD is a resistant clone isolated when the parental cell line was treated with afatinib, a targeted chemotherapy that focuses on the Epidermal Growth Factor Receptor (EGFR) family. This receptor family plays a crucial role in the growth and proliferation of cancer cells.
We performed a growth curve to showcase the difference in the growth of the resistant clone and the parental cell lines. This was conducted in a 6-well plate, with two plates used for each cell line.
Initially, we transferred the cells intended for use into a 15 mL test tube to facilitate distribution into the growth curve assay. Subsequently, we digitally counted the concentration of each cell line’s sample using trypan blue. Trypan blue marks intracellular proteins of dead cells, permeating through the dead membrane. The CountessTM Automated Cell Counter interpreted this by counting the unstained cells.
Once we determined the concentration, we calculated the amount needed to add 1 x 10⁵ cells to each well. Additionally, we calculated the amount of media required for each well with added afatinib.
After completing the calculations, we began plating the cells. During my initial attempt, I forgot to pipet the cell suspension up and down, resulting in only adding media instead of cells. I restarted with a new plate, adding afatinib first with the media and then including the cells.
We placed the cells in the incubator at 37 degrees Celsius and monitored them daily. Every two days, we stopped two wells for GD and OE33 to stain them with crystal violet after fixing them with 70 percent ethanol for our growth curve analysis, as shown below.
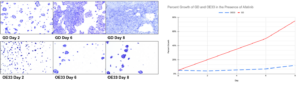
The data collection concluded on day 8 as the GD cells began to lift and run out of nutrients, resulting in death. Ultimately, this displayed the persistence of GD in the presence of afatinib.
Thank you for reading! I will be discussing our interpretation of the data so far next week.