Week 6: Real Results!

Aryan R -

Introduction

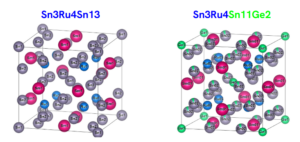
So for those of you who are not super acquainted with DFT and don’t have a lot of experience in materials science (which I presume is true based on probability, and hope is true on the account of having easier questions and comments to answer), this whole process might seem abstract to you and hard to visualize, which it definitely can be. Today’s blog should allay those reservations as you will be able to see what I have been working toward this entire time!

Graph Time!

Above are some lattices I produced in VESTA that are visual representations of each material, and should give you an understanding of what type of atom we are investigating.
Above is the calculated band structure of Sm3Ru4Sn13.

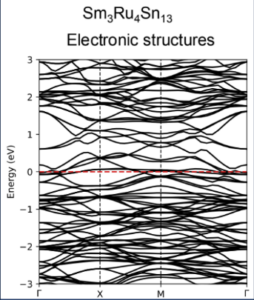
The band structures show no visible band gaps-which are empty spaces where the “spaghetti” don’t cross each other at all-emulating metallic behavior. Although good thermoelectrics exhibit properties similar to metals, they have pronounced band gaps. Overall, this graph doesn’t seem to be as promising as I had hoped in indicating that this materials would be a good thermoelectric, as it suggests that it would be pretty average amongst most materials in thermal and electrical conductivity.

What’s Next?

Now, I need to produce the projected density of states (pdos) graphs in order to figure out which parts of the materials actually lead to the characteristics we are seeing. It will also shed more light onto the transport properties of each material. After that, I will undergo the process I have bene going through for the past 6 weeks to simulate Sm3Ru4Sn11Ge2, which should take less time now that everything is sorted out. I hope to see you all excited for next week! Thank you so much for reading!

More Posts

Comments:

All viewpoints are welcome but profane, threatening, disrespectful, or harassing comments will not be tolerated and are subject to moderation up to, and including, full deletion.

    Anonymous
    Ni hao chao hola. Can you explain how the graph is supposed to be read. Why do some parts of the graph have more concentrated overlaps/larger overlaps than others? Also, what do these overlaps physically represent/what is causing these different energy states?
    Anonymous
    also this is derek no idea why im anonymized im pretty sure im signed in
    Archisha Rajesh
    Hello Aryan. This is quite a unique project! You mentioned how the band structures show no visible band gaps. Do you think applying a strain or manipulating the material in some form would open up a gap and potentially enhance the thermoelectric activity?
    aryan_r
    Great question Derek! The y-axis is energy in eV and the x-axis is reciprocal space. Each string is a physical band that holds electrons within the atom, just at different energy levels, which lines up with how electron shells/orbitals work. Where they overlap more, that just means there is a higher degree of hybridization between electron bands. The bands are the way they are based on how electrons move within the material. Because there is no band gap, we can deduce that this material is metallic, because a band gap essentially represents how far electrons have to "jump" to get to the next band.
    aryan_r
    Yes, manipulating the material could potentially increase thermoelectric efficiency. Filled skutterudites are materials that are filled with the atoms we desire (Sn and Ge) in the empty shell (Sm and Ru). I expect there to be a difference between the Sn13 and the Sn11Ge2 compounds in their thermoelectric efficiency for this reason. However, the materials added need to be less metallic and more like semi-metals and insulators in order to open up a band gap.

Leave a Reply

Your email address will not be published. Required fields are marked *