3/4/24. Lines, Lines, and More Lines of Ink
Frank L -
Previously, I mentioned that I had started helping out with a new research project by creating a contour detection program. Before I go into how the program went, I’ll give a brief overview of the project first. This time, the project doesn’t have anything to do with the manufacturing process of welding, instead it’s focused on Aerosol Jet Printing (AJP), which is a method of high speed printing that involves mixing droplets of ink with gas and spraying it onto a substrate (e.g. paper or metal).
In the project, 3 different parameters of the printing process are controlled and their impact upon the print quality is evaluated. Those parameters are Specific Gravity (SG), Carrier Gas (CG) Flow Rate, and Print Speed. Hasnaa actually asked me to help make some presentation slides explaining these parameters, so I looked into the more of the details about AJP on my own. SG has to do with the density of the ink, CG Flow Rate measures how fast the gas carries the ink, and the print speed refers the rate that the printing head moves.
Alright, back to my contour detection program. Like I said before, the goal of this program was to quickly and efficiently crop out images to get rid of unnecessary background space. It seemed like a relatively simple task, but this program actually ended up being way more complicated than I thought it would be. I referenced some videos on Youtube to learn how to write the code, but I ended up making some small mistakes because I didn’t completely understand how the notation worked and also had to take some extra steps in order to get the result I was looking for.
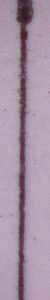
This is an example of one of the original images, a colored picture of a microscopic ink line.

After reading and scanning the images fed into the program, I then created a mask image, which was just a black and white picture that eliminated the dots in the background.

After the mask was created, I used a couple of special functions to locate the contours, which in this case would be the edges of the black line. I coded the program to then measure the area of the contours, calculate the position of a box that would surround the contours, and then crop the images based on the position and size of that box. The final result looked like this.
You’ll notice that the cropped image still has some extra background space on the sides. I left in that extra space on purpose, because I wanted to make all of the output images a standardized 200 pixels by 1200 pixels. This way, it’s easier to work with when we use the images for other analysis tasks later on.
Comments:
All viewpoints are welcome but profane, threatening, disrespectful, or harassing comments will not be tolerated and are subject to moderation up to, and including, full deletion.