Week 2: Plotting and Stacking – Time for Data Visualization
Mason t -
This week I want to show the actual light curves of the meteors and a bit more about how the stacking part of the project actually works.
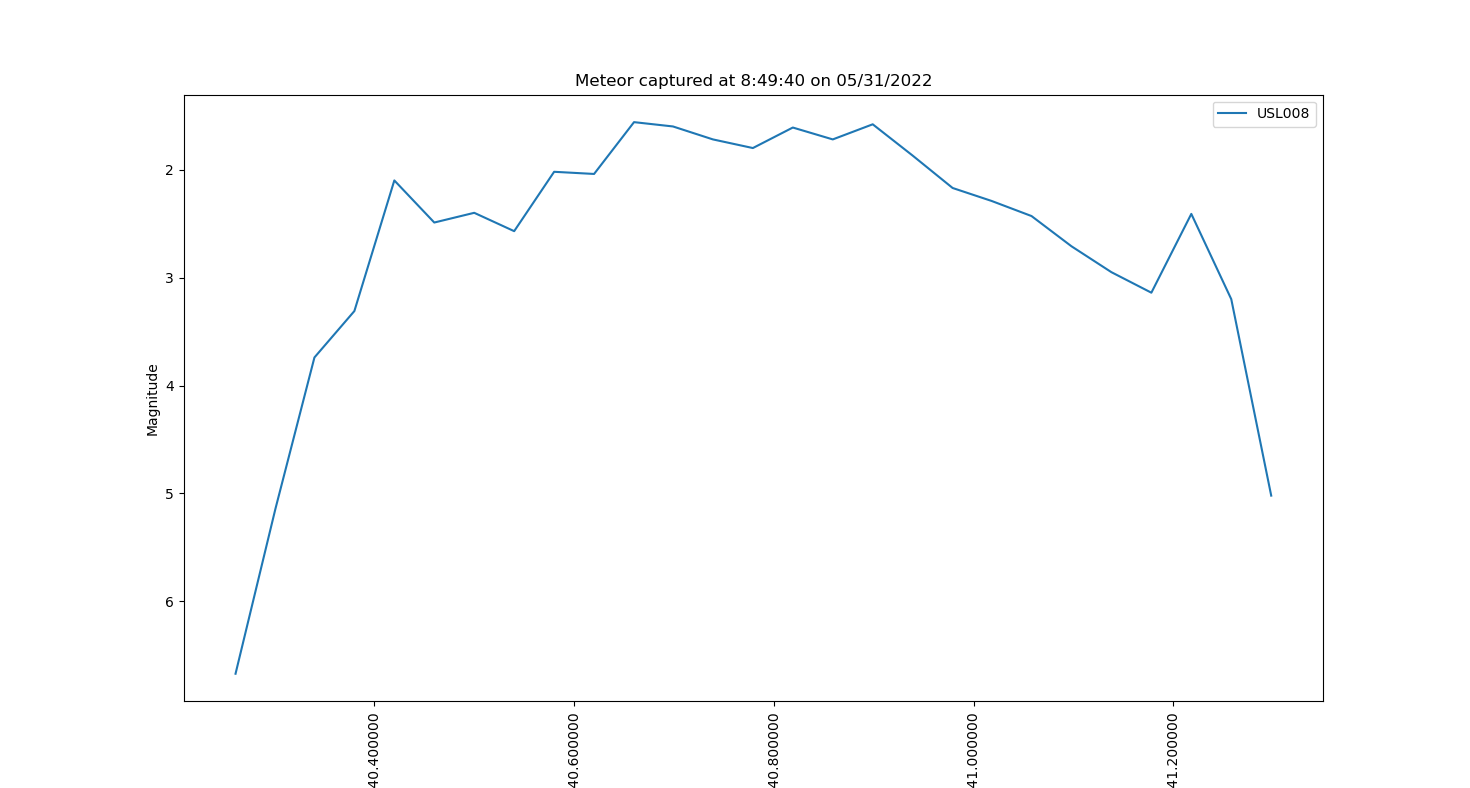
I wrote a function in my code that allows me to graph the light curve data of a meteor detection. This allows me to better visualize the code I’m looking at, and means I can show some of them in this blog post to all of you. There are still some errors here, such as the x-axis time (which is in seconds.milliseconds) having a bunch of tailing zeroes, but this plot shows the basic information that I need for simple analysis. The magnitude is on the y-axis, and is inverted because smaller magnitude = brighter. The x-axis shows time, and that comes out to a plot showing the magnitude of a meteor over a certain period of time. There is also a label system showing which camera contributed to which curve, which is shown on the upper right – in this case it’s camera USL008.
But we need to be able to look at more than just a single curve at a time. I wrote another function that allows me to call a dictionary (remember from the last post that each dictionary contains many names of detections each linked with a block of meteor light curve data) and ask it to make a light curve for each detection in the dictionary. For now I am manually placing each detection into a dictionary of other detections of the same object. For example, in the graph below, cameras USL008, USL00G, and USL00M all captured a meteor on 05/31/2022 at 8:49 and 40 seconds. I can graph all of these detections on the same curve instead of separately, and since it’s all the same meteor being detected, the graphs should look pretty similar, as seen below.
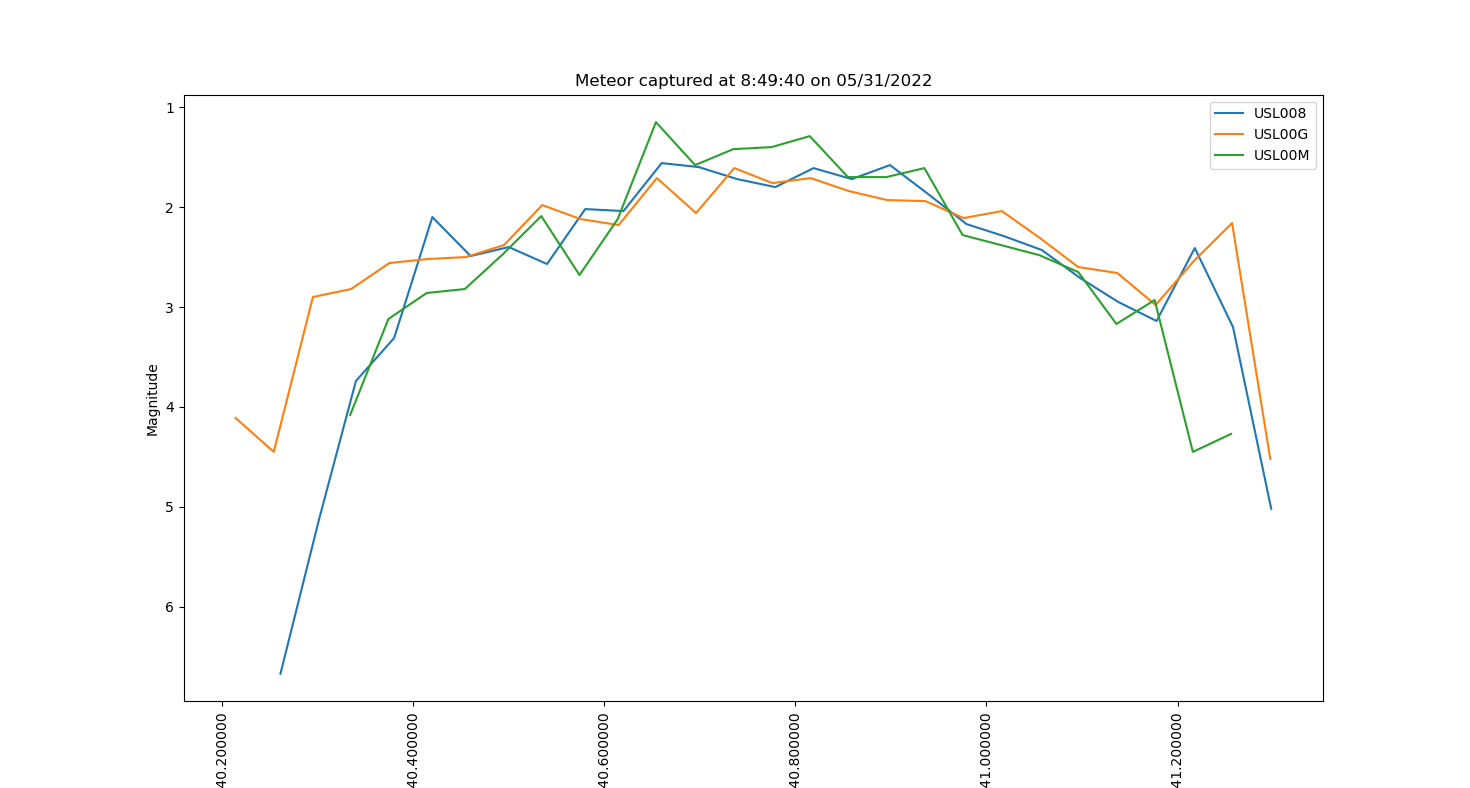
Now I can actually do analysis on this group of curves, figuring out what features are noise and which ones are actually spikes in the light curve will be one of the first things I’ll do.
Sometimes, small bugs in the code get blown out of proportion as the project grows more and more, and big issues later on can be tracked back to tiny errors earlier in the code. For example, when I was working on the stacking curves section of the code, I ran into an issue where the curves would not line up on the x-axis. This should be impossible because the cameras are constantly being recalibrated since time is one of the most important factors in analyzing light curves. It ended up being a small bug earlier in the code where I forgot to factor in milliseconds into the code that calculated where the light curve goes on the x-axis. This tiny miscalculation led to a big issue later on, which is why its important to always iron out each part of the code before moving on.
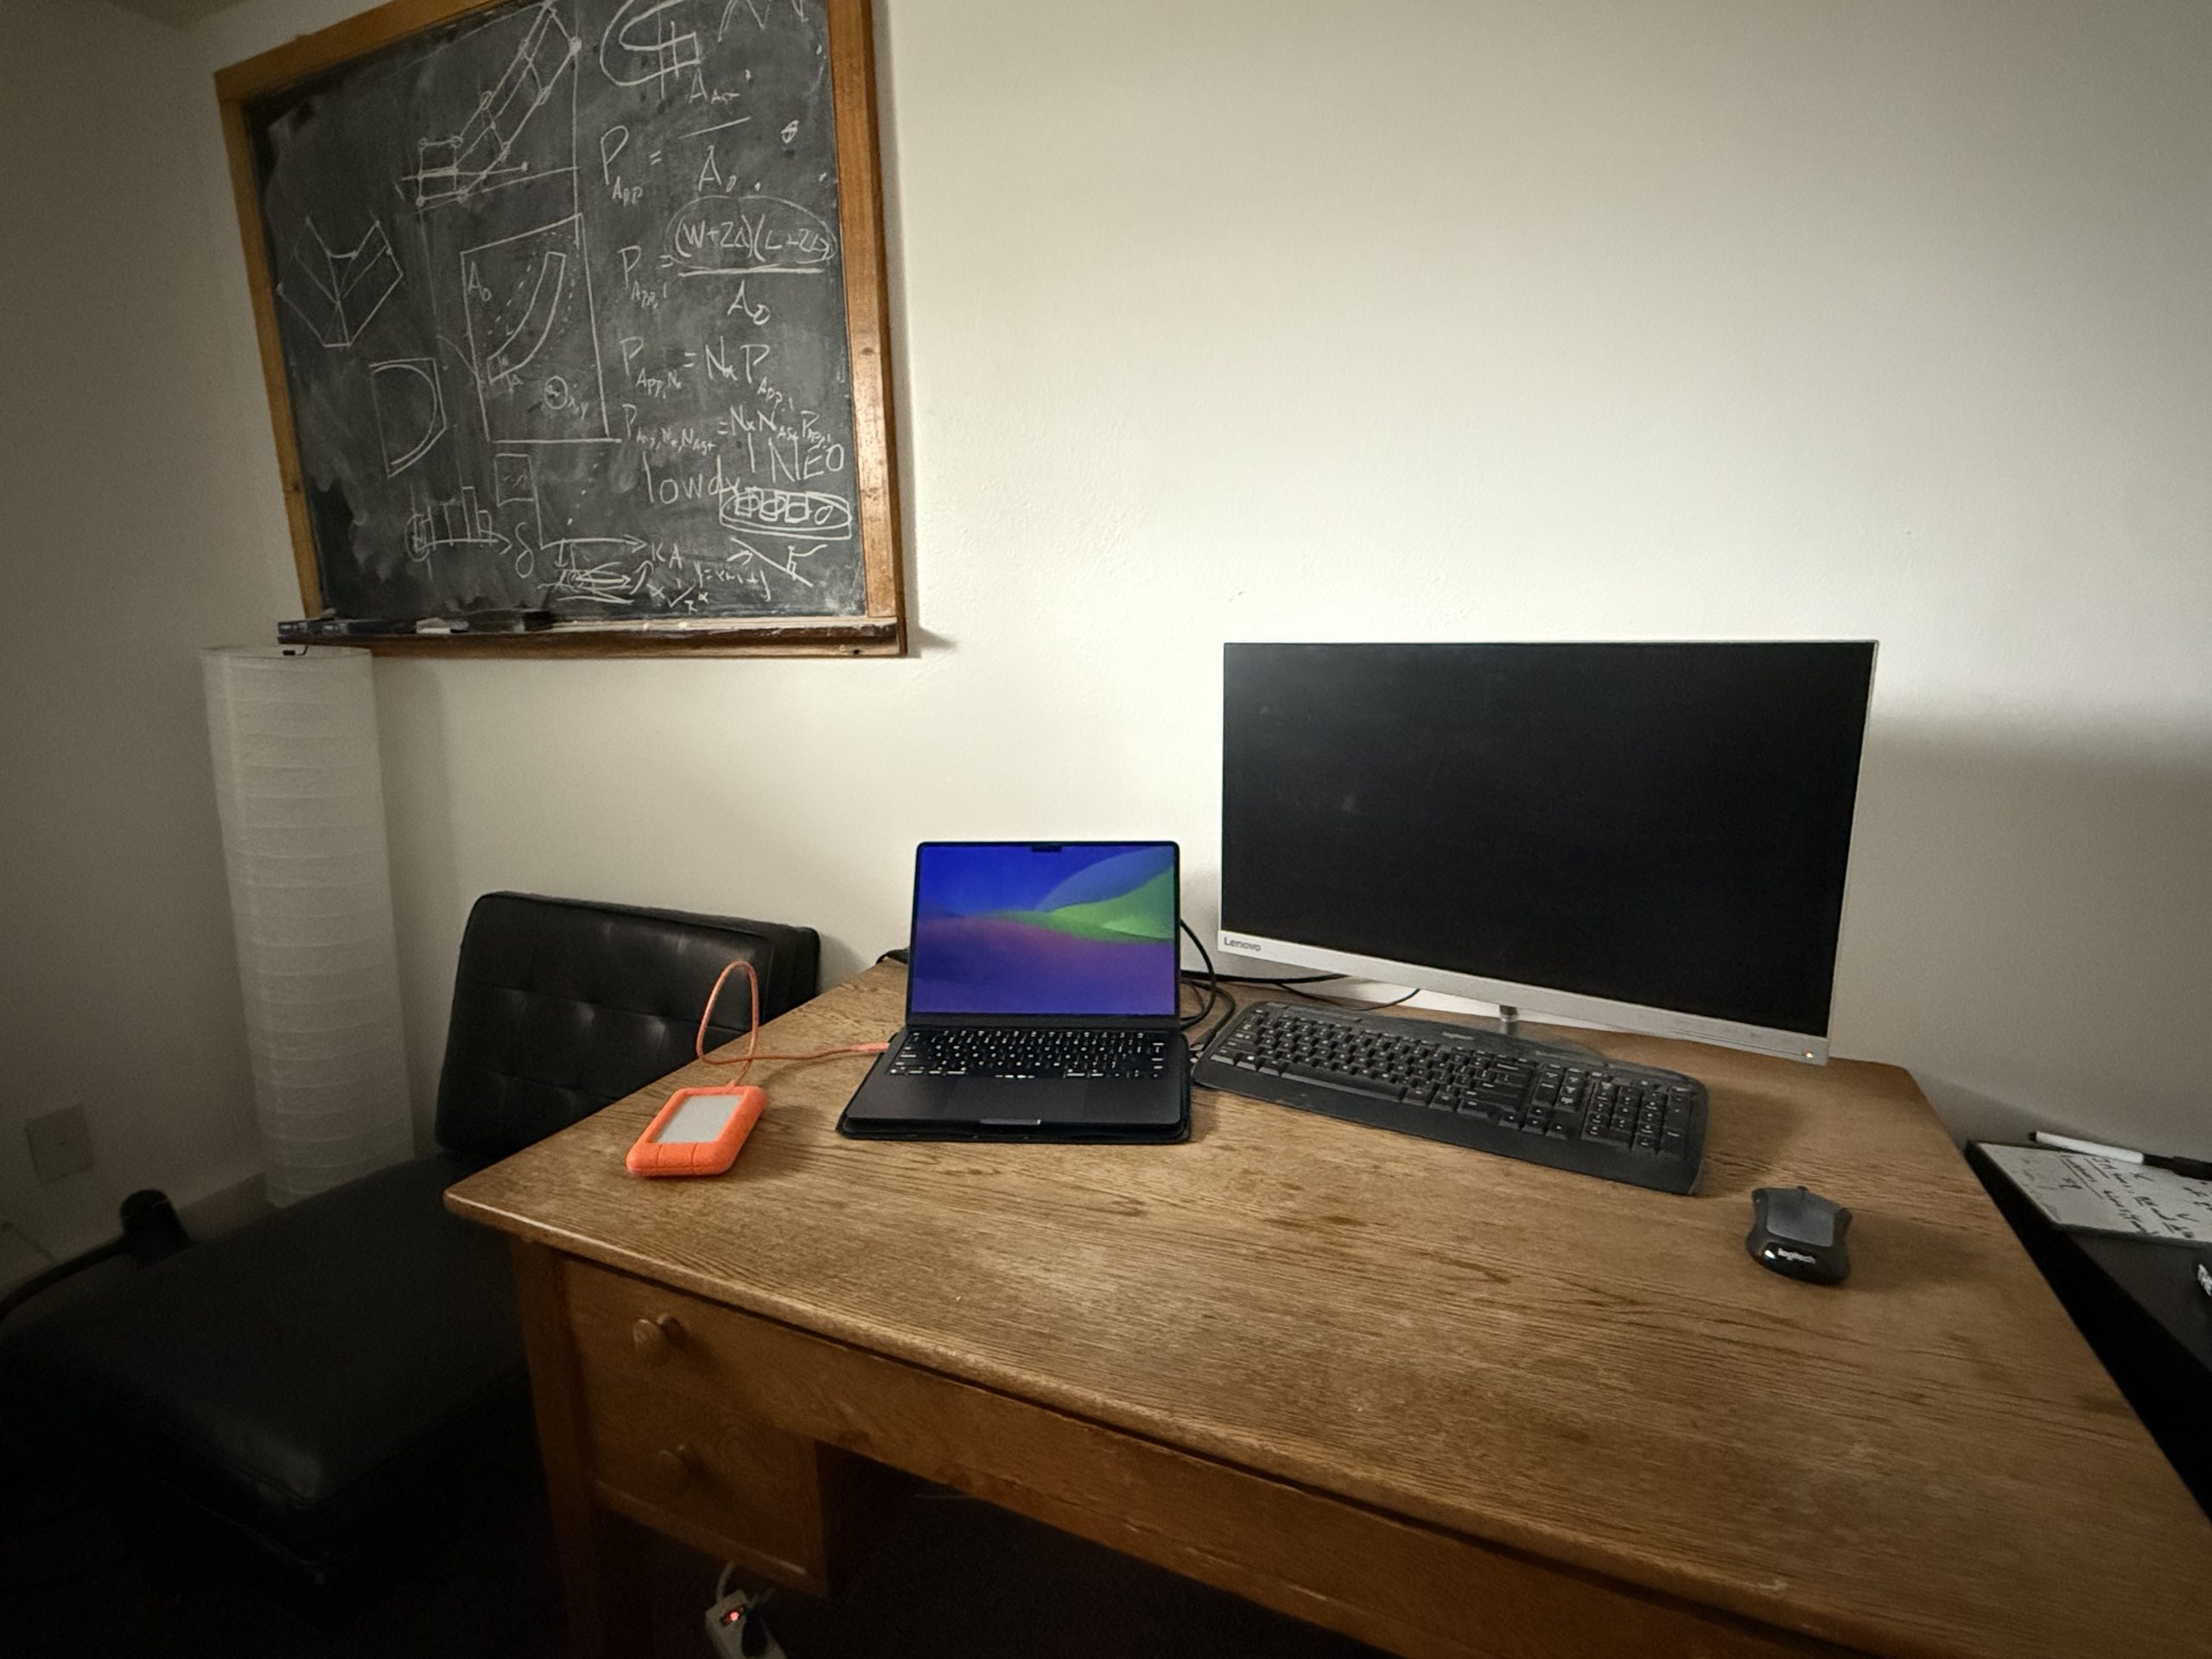
On a side note – here is where I’ve been working up at Lowell. So even if I encounter bugs I have a nice place to work on fixing them.
Comments:
All viewpoints are welcome but profane, threatening, disrespectful, or harassing comments will not be tolerated and are subject to moderation up to, and including, full deletion.