Week 10: The Last Leap
Katie b -
As my project is starting to wrap up, there are some final steps I have made.
After receiving my 3D-printed toe box, it turned out super cool! It looks like an actual pointe shoe. However, of course it was barely too small to where I could not fit my foot inside to properly test it out. 🙄 But I am not afraid of a little trial and error. In order to create this box, I had to play around with new tools on SOLIDWORKS that I did not need to use when creating my shank. Since I was figuring it out by myself, I was destined to make a few mistakes. The first one being my design was way too thick. In order to create a three-walled shape, I used the “shell” tool and set the thickness to 3mm. I didn’t realize this meant 3mm inwards and 3mm outwards. So, when I got my printed model back it was 6mm thick. Oops! I opened my SOLIDWORKS design back up to make some changes. I decreased the thickness of the walls to 1.5mm which will help to widen the box. I also adjusted the roundness of some edges to make it less sharp and pokey so it doesn’t dig into my foot. I have sent these updates back to the 3D-printing guys, and I will hopefully have a new model by my presentation next week. For now, here are some pictures of the original model.


The second thing I conquered this week was some data analysis of the SOLIDWORKS simulations from a few weeks ago. After another meeting with one of the guys at Gore, I was able to get a more detailed understanding of the simulation software and some screenshots to support our findings for each material. We simulated a total of 4 materials: one control and three experimental.
The first material we tested was steel. This was our control group so that we could ensure the software was working and performing as expected. A shank made out of steel should barely bend/move when a body weight force is applied, making it a good baseline measurement. This is exactly what we found when measuring the displacement. In the image below, the red color represents areas with the largest total displacement, and this was only 0.1865mm.
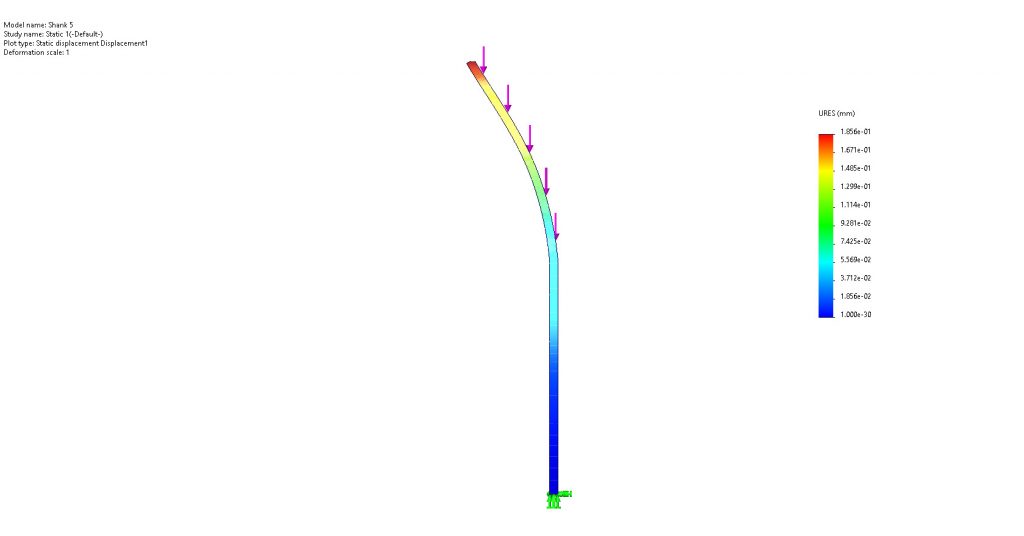
The second measurements we looked at were the von Mises stress values. Von Mises stress is a value used to determine if a given material will yield (permanently deform) or fracture under a certain load. Once again, a shank made of steel should certainly not yield under a body weight load, making it a good comparison. Thankfully, this is what the computer found as well; the yield strength of steel exceeded the maximum von Mises stress in the simulation.

Now that we had confirmed our simulation was performing realistically, we could move forward with testing more materials. The three materials we simulated were PLA, PETG, and Nylon 6/10. The images below show the displacement and von Mises stress for the PLA simulation. I am only going to insert the screenshots from this simulation for the sake of not making this post extremely large, but I will share the quantitative results we gathered for the other materials as well. As you can see, the point of maximum displacement for PLA was 35.75mm. This was not surprising as I knew it would bend more than steel, but it is still a relatively stiff plastic.
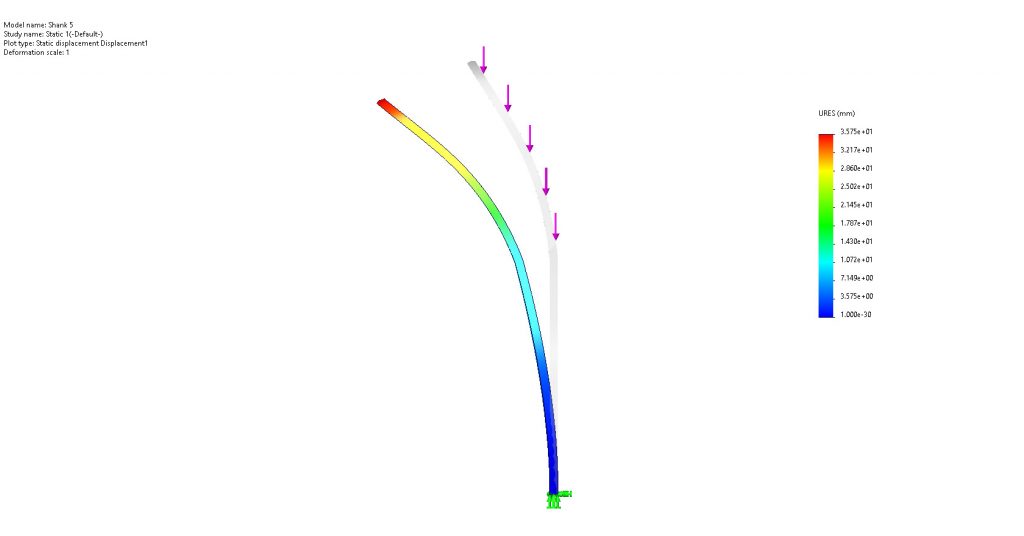
Now looking at the stress, the PLA performed similar to the steel; the yield strength exceeded the maximum von Mises stress meaning that the shank would not have permanently deformed or fractured.

Finally, here are our findings for the last two materials. The Nylon 6/10 performed similarly with a maximum displacement of 59.35mm, and it did not yield. However, the PETG had a much larger maximum displacement of 106.5mm, and it did yield under a body weight load. This was very surprising to me because I have tested a PETG shank in person, and I did not find any evidence of it being permanently deformed. Overall though, I am super happy with how the simulations turned out, and I am excited to have some quantitative data to add to my presentation.
Moving into this final week, I will be working on cutting time off of my presentation since it was slightly too long when I practiced with the Senior Project Committee. I am also hoping to get my new toe box model soon so that I can quickly try it out over the weekend. But… I am super excited to finally get to share my project with more people next week, and I can’t wait to hear everyone else’s presentations!
Comments:
All viewpoints are welcome but profane, threatening, disrespectful, or harassing comments will not be tolerated and are subject to moderation up to, and including, full deletion.