Week 3: Improving ARIMA

Johnny Y -

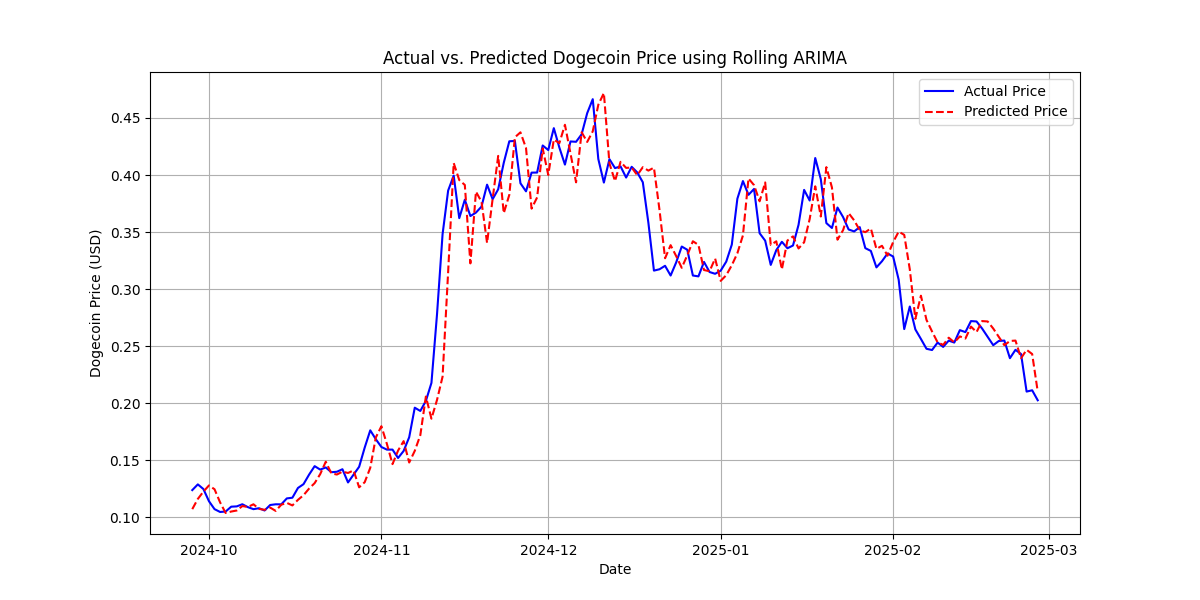
This week, I focused on improving the performance of my ARIMA model. I examined potential alternative baselines just in case (random choice, tweet volume, and a random forest classifier), and tried various improvements. These included using a logarithmic scaling, functions like auto_ARIMA to find parameters, AIC, and a rolling window. Logarithmic scaling didn’t address the problem, since the data had sustained increases in price rather than temporary spikes. Auto_ARIMA didn’t work with my version of Python for some reason, so I used the Akaike Information Criterion (AIC) instead. AIC assigns a score to each ordered triple (p, d, q) of parameters; the lower the score, the better. Thus, I looped through each possible ordered triple and used the one with the lowest score. While AIC helped a little bit, the biggest improvements came when I implemented a “rolling window” approach. Instead of training the model on a fixed dataset, I re-trained ARIMA for each day in the testing dataset based on the past 30 days. ARIMA would be trained on the previous 30 days and make a prediction for the next day; then, the 30-day window would move one day forward, and ARIMA would be re-trained and make a prediction for the following day (i.e. the prediction for Jan 31 would be based on the data from Jan 1 – Jan 30, the prediction for Feb 1 would be based on the data from Jan 2 – Jan 31, etc).

Though it took longer to run, this overcame ARIMA’s inability to deal with sustained price increases, leading to significant accuracy improvements. Mean Absolute Percentage Error decreased from 40.77% to 6.66% for exact forecasting, and up/down forecasting accuracy improved from 47% to 60% (now significantly better than random chance). This method also reduces the amount of training data needed. Below is a chart comparing the model’s predictions to actual prices (generated in Python using matplotlib).

More Posts

Comments:

All viewpoints are welcome but profane, threatening, disrespectful, or harassing comments will not be tolerated and are subject to moderation up to, and including, full deletion.

    tesla_l
    What causes it to predict the large dips then spikes between 2024-11 and 2024-12? Everywhere else on the graph doesn't deviate from the actual price as much as it does around this area.
    makeen_s
    Hi Johnny, what is it that makes the predicted price closely follow the actual price but be slightly lagging?
    austin_l
    Looks pretty close! Is there a reason that the predicted price is usually following the same general pattern but lagging behind a few days?
    aditya_s
    How did you know to implement the rolling window approach?
    johnny_y
    Thank you for your question, Tesla! I'm not exactly sure, but I hypothesize that the dips and spikes around that area reflect the drastic increase in average volatility due to the 150% price increase in November.
    johnny_y
    Thank you for your questions, Makeen and Austin! ARIMA depends on past values to make predictions (it can only react to changes after they happen), so it takes some time for the model to 'catch up' if there's sudden shifts.
    johnny_y
    Thank you for your question, Aditya! I came up with the "rolling window" approach on my own, but the results looked good with it and my site advisor approved, so I utilized it. The idea was that it would resolve the issue of ARIMA staying too close to the average value of its training dataset by allowing ARIMA to re-train itself as new data came in, and by keeping the window small, new data would be given more weight.
    daniel_w
    Wow Johnny, this looks incredible! Is ARIMA a model I can run on my laptop using Python, or does it require more specialized computing equipment? Are you uploading your model to a Github repository? If so, please send the link! Thanks in advance!
    johnny_y
    Thank you for your question, Daniel! Yes, you can run an ARIMA model using Python. I'll upload everything to a Github repository once I'm done with the project, but you can view the draft I used to make the chart here: https://github.com/johnnyhyu/Senior-Project-2025/blob/main/ARIMA_Rolling.py

Leave a Reply

Your email address will not be published. Required fields are marked *