Week 2: Bleeding Numbers – Cracking the High School Donation Code
Mohin P -
This past week has been eye-opening as I’ve dug deeper into the world of high school blood donations. I had a conversation with Jay, who specializes in donor marketing and community engagement, about an issue I discovered last week: how high school donor demographics haven’t really changed pre- and post-COVID. That might not seem like a big deal at first glance, but it actually proves something important: instead of targeting specific demographics, we need to focus on increasing engagement from high schools as a whole to bring donation numbers back to where they were before the pandemic.
Jay found the data particularly intriguing, especially since he’s trying to push back against proposed regulations that would make it even harder to collect blood donations. One proposal would require separating donations from people who received the COVID vaccine versus those who haven’t—an unnecessary hurdle that would slash an already low supply. Another would impose stricter guidelines on high school donor programs. The numbers I gathered could help his fight against these policies, which makes this work even more critical.
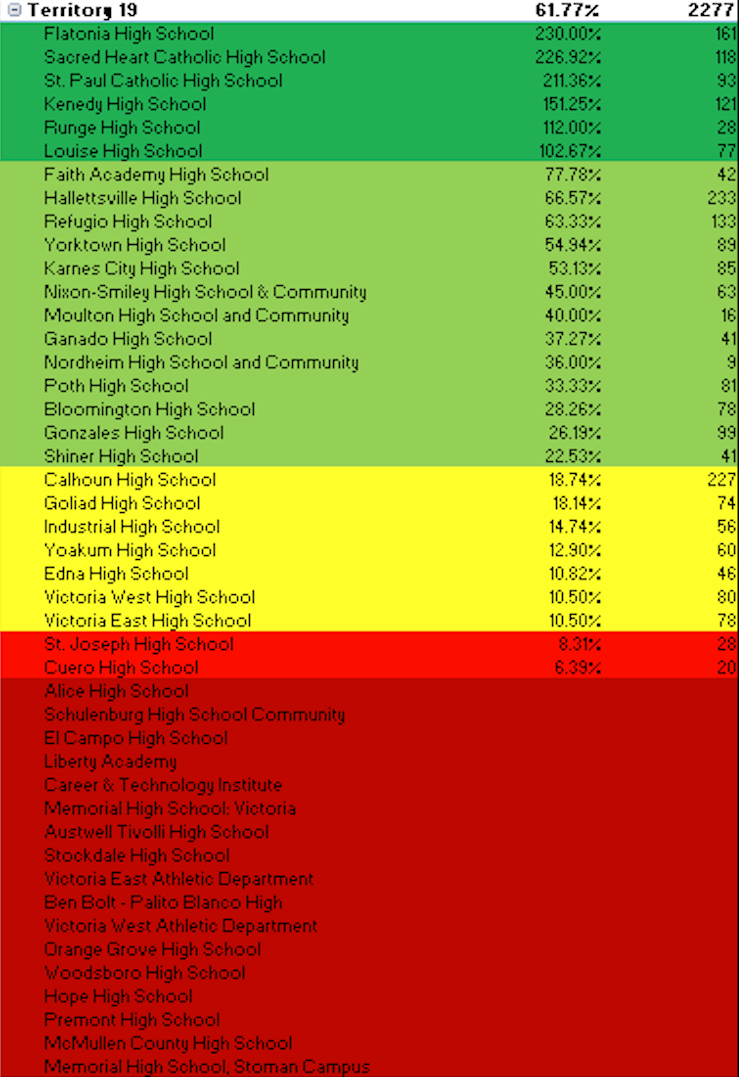
Digging into the data, I compiled and analyzed penetration rates for all high schools in our network throughout 2024. (For context, penetration rate = the number of actual donors divided by the number of eligible donors at a given school.) What I found was surprising. Of the 244 high schools registered with STB&T (South Texas Blood and Tissue), 113 of them haven’t donated at all in the past year. That’s nearly half. On the flip side, only 41 schools had a “good” penetration rate of over 20%. That’s just 17% of all schools in the system. Clearly, we have a lot of work to do.
I shared this information with Neil, who manages mobile blood drives for schools already in our system. He made a great point: before we start throwing resources at schools, we need to distinguish between the ones that dropped off after COVID versus those that were never engaged to begin with. That led me to my next deep dive, which is comparing each school’s donation history before and after 2020.

Armed with this new perspective, I took the findings to Yvonne and Rudy, who are responsible for reconnecting with old schools and reaching out to new ones. Now, instead of blindly trying to boost numbers across the board, they can pinpoint exactly which schools need attention and why. The trends are clear: 2019 was a standout year for high school blood donations. Then COVID hit, and while some schools bounced back, many haven’t. Some even dropped out entirely.
The road ahead is clearer now. We know which schools need re-engagement, which ones have untapped potential, and where our efforts will make the biggest impact. However, there is still more work to do. We need to figure out how many unique donors we are bringing in versus repeat donors, as well as take into account each territory’s unique situation when it comes to blood donations. Understanding these factors will help us better and more efficiently coordinate outreach efforts moving forward.
More updates to come!
Comments:
All viewpoints are welcome but profane, threatening, disrespectful, or harassing comments will not be tolerated and are subject to moderation up to, and including, full deletion.