Week 4: Peering Beneath the Surface – Pixels to Practice
Rows, and rows, and rows of numbers! This week was dedicated to analyzing phase I of the data collection. This part includes evaluating solely the image quality of each of the 6 handheld ultrasound devices for each of the 3 views [(1) abdomen right upper quadrant view, (2) apical 4-chamber view of the heart, (3) superficial view of the right neck and lung of the anterior chest wall].
To understand exactly how these individual image quality exams were evaluated, let’s step into the shoes of the point-of-care ultrasound (POCUS) experts to see exactly what they were assessing. Take a look at the figures below. Both Figure 1 and Figure 2 show the captured images of the same view on the same standardized patient (“models”) with each of the six different devices.
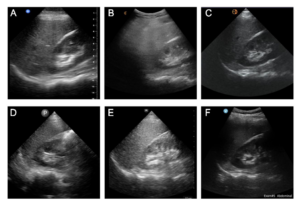
Take a look at another one.
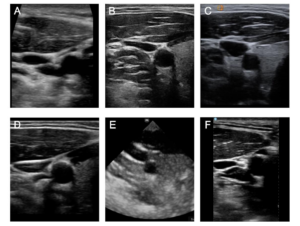
You may not have a trained eye for reading ultrasound scans, but just utilizing your observational skills, which ones do you think have the best resolution? The sharpest, cleanest, and brightest white lines? The least amount of extra haziness? Comment your answer below, there’s no true “right” or “wrong” answer. This is basically what the POCUS experts are looking for when evaluating handheld ultrasound devices. Each POCUS expert was given 3 data collection forms for the three views and was instructed to rate 5 characteristics (which are specific to each view) for each device from 0 (“poor”) to 3 (“excellent”) and give an overall rank for each of the devices from 1 (“best”) to 6 (“worst”).
Jumping back to the data analysis, let’s dive into how the individual image quality exams were analyzed. As you will notice below, this part of the data analysis could easily be analyzed on Microsoft Excel or Google Sheets with a simple calculator function. However, to maintain consistency in the analysis, we selected R Studio, which is a free data analysis platform. First, scores were calculated by finding the mean score of each of the 5 characteristics across raters. Second, the 5 mean scores were added together to make a “total score” for each device. Third, a summary of the rankings was listed for each device to show the number of times each device was ranked 1st, 2nd, 3rd, etc. Fourth, a “ranking score” followed the summary of rankings which assigned a score of 6 for a 1st place rank, a score of 5 for a 2nd place rank, and so on, to a score of 1 for a 6th place rank; These scores were totaled across all 35 users to yield the “ranking score”. This data analysis process was repeated 3 times for each of the views to yield 3 tables summarizing the data for each of the individual image quality exams. And next week, this data will be converted into a chart for visual and aesthetic purposes!
The majority of these past weeks and coming weeks are not solely dedicated to staring at rows of data on a computer screen. Since I am conducting my project at the Audie L. Murphy Veterans Memorial Hospital, I have a volunteer status, which requires me to volunteer but allows me to shadow in the hospital. I have spent the past few weeks in the Medically Intensive Care Unit (MICU), which is the unit for patients with serious medical problems who are severely ill, which can be physically and emotionally taxing at times. Yet, it is a great learning experience from a variety of aspects. Just concerning ultrasound, I’ve seen some neat pathologies that provide some tangible meaning and purpose to the research that I am conducting and the way that it can transform practices in medicine.
Thanks for reading this week! Hope to see you again next week : )
– Riya