Week 4: Revenge of the Samples
Edie L -
I think my samples have a grudge against me.
Specifically Ibuprofen and L-Lysine. Tylenol has been nice to me, but even Acetaminophen has been trying to get away from me. I just came back from doing a revised version of the lab last week. This time we reduced the range so instead it it being 400-40000 the range is now 650-3500. This lets us narrow down the graph to get a more specific result. We thought last week that the range was too broad for the library, so we wanted to see if this new range would help. We also increased the number of scans that we are doing. I am testing each sample five times, each time I will increase the number of scans. For each of my samples, the first test the spectrometer will only scan the sample once. The next test, it will scan it eight times. Test three will scan the samples 16 times. Test four will scan 32 times. The final test will scan the samples 64 times. I noticed that each time I increased the number of scans, the smoother the graph became. I did run into some problems. This is where I think my samples are holding some sort of grudge. I have to scoop out a tiny portion of the crushed powders and place it onto a small window. Seems ok, right? Sure it would be challenging scooping a small portion, but other then that you just need enough to cover the window. Seems simple and straight forward, right? Well not when the powder wants to be difficult. Every time I tried to scoop out a small sample, it would fall off. There were so many grains of powder going everywhere but the window I needed them to be in. Sometimes whenever I got them on the window, The sample would stick to the scopula, and I would need to scoop a little more because I would give up trying to get it off and flattened to the window. Some other problems that happened was that I would get ethanol as the top result for what the spectrometer thought it was. Why is the a problem? Because I used ethanol to clean off the equipment and decontaminate the area. Ethanol dries up quickly, but some of it stayed behind and messed up the results. I’ll have to wait a little longer next time to give the ethanol enough time to dry up.
The next day, I wrote a lab report for Professor Eaton. Nothing too exciting happened on this day.
I went back to the lab, and tested the sample again. We are almost done! I just need to come back so we can time exactly how long it takes.
I found out the entire lab we are going to make takes about 1hr and 10 minutes total. The lab will test one of the four samples four times. Students will increase the number of each scan. The first time the spectrometer will scan the sample once. The next time it will scan it 10 times. The next will be scanned 46 times, and the last will have 64 scans. after that students will scan the other two samples once. Each will have 64 scans. After that They will test an unknown sample, and look at the other graphs to try and match up the unknown graph with a known graph. Finally students will treat the data to try and make the samples more clear.
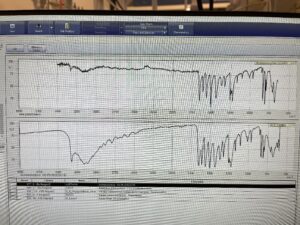
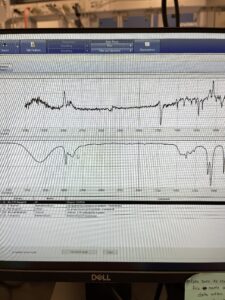
The graphs below are not great but the one on the left shows a good result with acetaminophen as the top result. The graph on the right is Ibuprofen that has ethanol as the top result. I have gotten very familiar with this graph unfortunately.


Comments:
All viewpoints are welcome but profane, threatening, disrespectful, or harassing comments will not be tolerated and are subject to moderation up to, and including, full deletion.