Week 2: Modern Tools for Bayesian Statistics

Ian M -

This week, I dove deeper into the tools needed for Bayesian statistics, and a major part of my work involved setting up RMarkdown, my main method of data integration and typesetting for efficient data analysis. RMarkdown is a powerful tool that allows you to create documents that integrate code and output with standard writing. It is especially helpful for reproducible research, as it allows you to execute R code directly within the document and display the results easily.

To aid my analysis, I installed key packages like brms and rstan to handle the Bayesian modeling. brms is an R package that facilitates Bayesian regression modeling using Stan, a probabilistic programming language for statistical modeling. It provides a user-friendly interface to fit complex Bayesian models without needing to write the typical Stan code directly. rstan, on the other hand, is the R interface to Stan itself, providing access to the full power of Stan’s modeling capabilities. Together, these tools enable me to specify and fit a wide range of Bayesian models with ease and flexibility.

Setting up RMarkdown with the required packages was relatively straightforward. I started by ensuring that I had R and RStudio installed, and then installed RMarkdown through the RStudio interface. Once that was set up, I loaded the necessary packages for Bayesian analysis, most importantly brms and rstan, as well as other miscellaneous packages specific to certain types of Bayesian modeling. These packages work together to facilitate the estimation of Bayesian models, making it easy to specify and interpret complex data relationships common to the game of baseball.
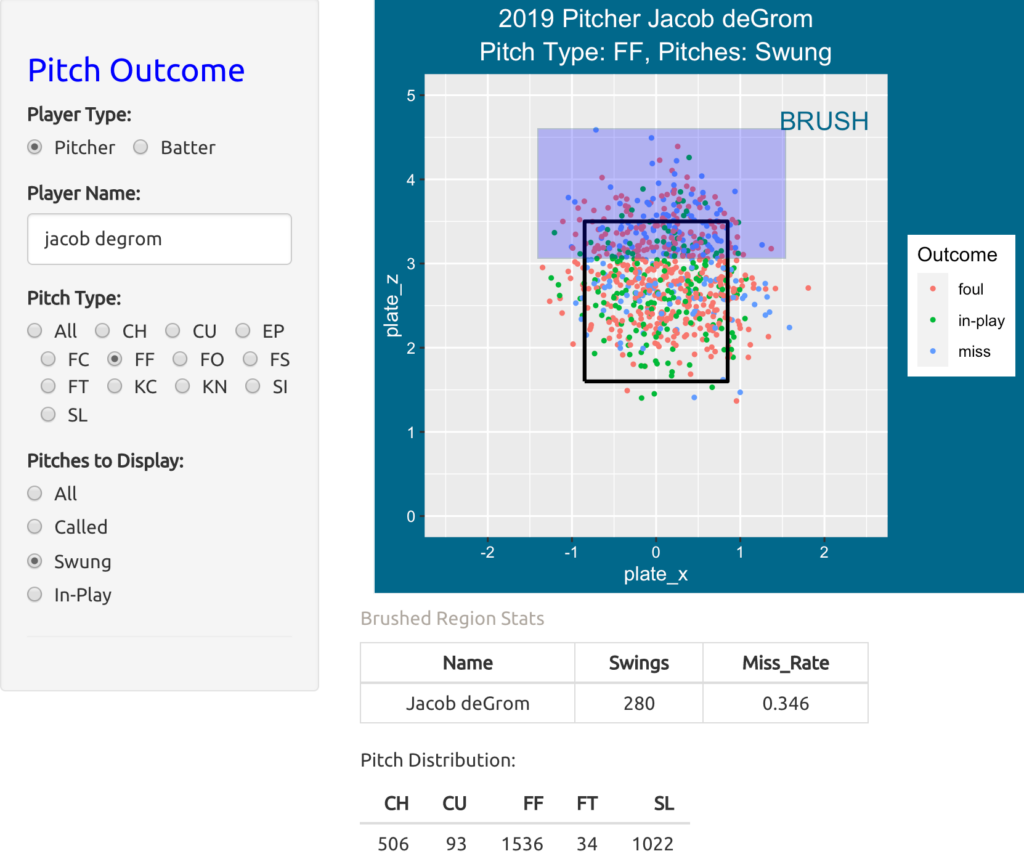
 

An example of one of the capabilities of the mentioned programs. Here, we can make a scatterplot of a pitcher’s pitch outcomes depending on location. A brush feature also allows us to analyze specific areas on the plot. Credit to Jim Albert, Introduction to ShinyBaseball Package, Version 0.5.3.

A critical part of this process was also setting up MikTeX. MikTeX is a LaTeX distribution that enables RMarkdown to generate high-quality PDFs and compile LaTeX code, which is especially useful for creating polished reports with mathematical notation. I installed MikTeX to ensure that my RMarkdown documents could render with proper support for LaTeX code. After installing MikTeX, I configured it within RStudio by linking it to the application, ensuring everything was ready for generating reports and models.

Overall, this week’s setup of RMarkdown and MikTeX, along with the brms and rstan packages, laid a strong foundation for my Bayesian analysis project moving forward. These tools will greatly enhance the analysis and visualization of my statistical models in upcoming weeks.

More Posts

Comments:

All viewpoints are welcome but profane, threatening, disrespectful, or harassing comments will not be tolerated and are subject to moderation up to, and including, full deletion.

    nakyung_y
    Hey Ian, so far, Bayesian statistics sounds really cool but really complicated as well. Do you think there will be any computational challenges when running complex models with large baseball datasets? If so, do you know how you might address these challenges?
    Anonymous
    Hi Ian! It's amazing that you could find all these programs that help maximize the efficiency of the time-consuming process data organization! How did you come across all of these and learn how they fit with one another?
    emma_k
    Hey Ian! It's amazing how there's all sorts of programs today that can help maximize the efficiency of the time-consuming data organization step of this project! How did you come across these programs and figure out how they fit together (e.g. online, research articles, professors)?
    kathy_n
    Your process already sounds so cool, even though we’re only in the beginning stages! I can’t wait to see what’s in store once you actually begin creating statistical models.
    Anonymous
    The process of setting up for your project looks complex but really cool! The scatterplot is a fascinating way to visualize pitch outcomes. I can't wait to see how everything you've set up helps you with your project!
    avaya_a
    Your set up process seems complex but really cool! The scatterplot seems like a fascinating way to visualize pitch outcomes. I can't wait to see how these tools help your project in these coming weeks!
    ian_m
    Thank you for the question, Nakyung. One of the most significant computational challenges with these datasets and models is finding the datasets and models themselves to work with, as we often need large datasets for Bayesian analysis. Fortunately, sites like FanGraphs and Baseball Reference provide easy methods to export data for analysis, and both often feature articles on how to utilize certain analysis tools.
    ian_m
    Thank you for the question, Emma. Most of the programs I plan to use in this project were suggested to me by my advisor, Professor Joseph Watkins at the University of Arizona, and his insights have been crucial in learning how to use these programs together.
    ian_m
    Thanks, Kathy. I am quite excited to build statistical models that provide deeper insights into player performance than just traditional analysis.
    ian_m
    Thanks, Avaya. I thought that the scatterplot was one of the most interesting examples to introduce the Shiny Baseball package made by Jim Albert, as it uses the actual vertical and horizontal position of pitches as the data to graph the scatterplot.

Leave a Reply

Your email address will not be published. Required fields are marked *