Building the Foundations, Week 2
Welcome back to the second installment in my research journey. I spent this week getting dialed in and up to speed with all the background information I need to learn before going into my first projects at the lab. In this blog I will discuss some topics I’ve been studying and researching on my own with just a quick summary of all the areas I touched on. I got acquainted with the popular data science Python modules, Numpy, Pandas, Scikit-Learn and Matplotlib. After reviewing those, I dove into An Introduction to Statistical Learning, a six hundred page “crash-course” in machine learning with applications in Python which is precisely the tool I needed to sharpen my proficiency in machine learning theory. On the flip side of my project, I also studied a collection of Neurophysiology lectures to which my mentor gave me access, in order to establish a baseline competency in basic Neuroscience.
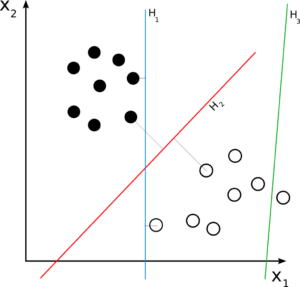
In general we divide machine learning models into two groups: models that accurately predict new data, and models that infer about past data. For the purposes of my project, I am only interested in models that predict. We can further divide models into another two sub-categories: Regression models, and Classification models. A regression model essentially seeks to predict a continuous value from prior trends, while a classification model seeks to distinguish between groups. For example, a regression model may take someone’s age and predict their income, while a classification model will decide if something is an apple or an orange. I am interested in a form of classification models: linear classification . The term lends itself to a more complex idea than it really is. I best understood this one through an image which I have attached. (Figure 1).
Now with the stage set, I can introduce the most basic model, K-Nearest Neighbors. This classification model predicts new data by comparing it to the closest or nearest data points or neighbors, hence the term “Nearest Neighbors”. (Figure 2). This makes intuitive sense that we can predict something new by comparing it to the “environment” it’s added to. For example, let’s say apples sink and oranges float. If I drop ten of each in a pool, the oranges will be on top and the apples at the bottom. If I drop a new unknown object in the pool and it sinks to the bottom, a K-Nearest Neighbors model will predict it is an apple since all its closest objects are apples. Here is another analogy to drive the point home: let’s invent a fictional neighborhood where every house has a kid who goes to high school in Oro Valley. Let’s also say a new kid moved in this neighborhood and we are asked to predict what high school he or she will attend. A K-Nearest Neighbors model would look at the closest houses and make a prediction based on the neighbors who are physically closest in this neighborhood. One last clarification I need to make is that the number of neighbors it uses to compute is subject to change, and often the source of optimization. I may decide to only look at the three closest neighbors. If two of them go to BOV, and one goes to CDO, it predicts this new house must go to BOV. For this reason, we usually decide to use a K value (number of neighbors) that’s odd to uphold a majority in the same way the Supreme Court has an odd number of judges to always have a majority.

Thanks for reading, I hope this week’s blog has offered some accessible insight into the rather technical side of my work. Stay tuned as I am looking forward to a workshop held by the Ricoy Lab this Thursday and some tangible experience to report back on next week.