Sentiment Analysis — Graphing Results and Conducting Analysis Part 2
Last week, I finalized all of my results from the sentiment analysis models and started my analysis. As a recap, the time graph plotted with sentiment scores to see how the overall legislation sentiment changed over time proved that there was essentially no change in sentiment over time.
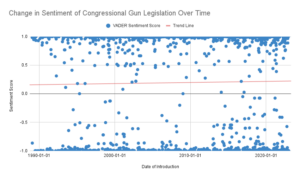
The graph proves that the sentiments of the legislation are very polarized, with a lot of legislative texts having values near 1.0 and -1.0. The trend line, with the equation y = 0.00000529x + -0.0161, where y is the sentiment score and x is the date of introduction, shows that as time goes on, the sentiment in legislation does become more positive but in extremely small increments.
The next result I analyzed was an overall distribution of legislation based on sentiments to visualize the polarity of the overall legislation, which was also seen in the time graph.
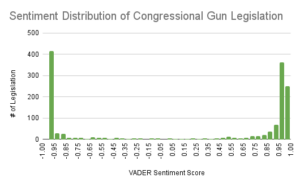
As seen in the histogram, congressional gun legislation is extremely polarized. There is barely any legislation in the neutral area, which is a sentiment value between -0.05 and 0.05. Instead, the histogram has a bimodal shape, with the 2 peaks being at the most positive and most negative scores. Additionally, the variance of the histogram, which tells us how spread out a set of data is, is 0.8617140271917337, meaning the data is very spread out.
In this week’s analysis, I answered the main question posed as the project’s goal: how does the sentiment differ in legislation from the 2 sides of the gun control debate? To do this, I filtered the histogram of congressional gun legislation sentiment by the legislation classification and graphed them below.
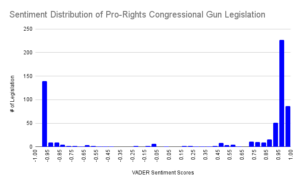
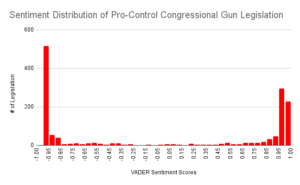
Both of these histograms are bimodal, with their peaks being at the 2 ends of sentiment scores. The variances for the pro-control and pro-rights data are 0.8761728282112569 and 0.7304608808344379, respectively. This difference in variance between the two histograms is significant, indicating that while both pro-control and pro-rights legislative texts are polarized, the pro-control texts exhibit a slightly higher degree of spread in sentiment values. This higher variance suggests that the language used in pro-control legislation is more diverse in its emotional expression compared to pro-rights texts. Essentially, pro-control advocates use a wider range of sentiment, potentially reflecting a more varied approach in how they present their arguments or address the issue. Conversely, the lower variance in the pro-rights texts may imply a more consistent use of language. This could indicate a more unified stance or a narrower range of emotional appeal in the rhetoric of gun rights advocacy. The bimodal distributions in both histograms affirm that both sides of the debate strongly emphasize positive and negative sentiments, with little room for neutral language. This polarization could be a reflection of the intense and often contentious nature of the gun control debate in the United States.
The analysis of these variances and distributions not only answers the project’s main question regarding the difference in sentiment between pro-control and pro-rights legislation but also provides insights into the rhetorical strategies employed by both sides. It appears that while the core sentiments are polarized, the way these sentiments are expressed varies between the two sides, possibly influencing the public and legislative response to these issues.
In the upcoming week, I plan to finish my entire research paper for CollegeBoard. I have already started working on the methodology section of my paper and plan to finish the rest by Wednesday, April 24th, 2024. My final presentation for AP Research is on April 26th, and the Senior Research Project presentation is on Saturday, April 27th, from 9:30 – 10 A.M. in Room 201. As always, I will continue working on my AP Research and internship tasks.