2/15/25 – Green Light
Anshum p -
These past two weeks marked the start of my senior research project and internship at Y2K Engineering, a company specializing in traffic analysis and transportation engineering. At Y2K, we conduct Traffic Impact Studies (TIS) to assess how new development projects will affect traffic flow in the surrounding areas. Our work helps private developers manage the movement of vehicles, ensuring smoother circulation on their development sites and minimizing congestion in the surrounding neighborhoods.
My days at Y2K begin with an 8:00 AM start, followed by a team meeting at 8:30 where everyone shares progress updates on their respective projects. I’m learning how to assist with Traffic Impact Studies by analyzing traffic data and helping prepare reports that include recommendations on managing traffic flow for upcoming development projects. During the first few weeks, I’ve been getting up to speed with new software tools such as QGIS (Geographic Information Systems) and Power BI. These tools will allow me to analyze and visualize traffic data to better understand how changes in development impact local roadways.
While I am gaining valuable experience working on TIS projects for Y2K, I’m also starting off on my research project, which focuses on analyzing traffic congestion and safety risks on Sky Harbor Boulevard in Phoenix. Using crash data from the Arizona Department of Transportation, I am identifying patterns in traffic accidents to pinpoint high-risk zones and better understand the root causes of frequent collisions and delays.
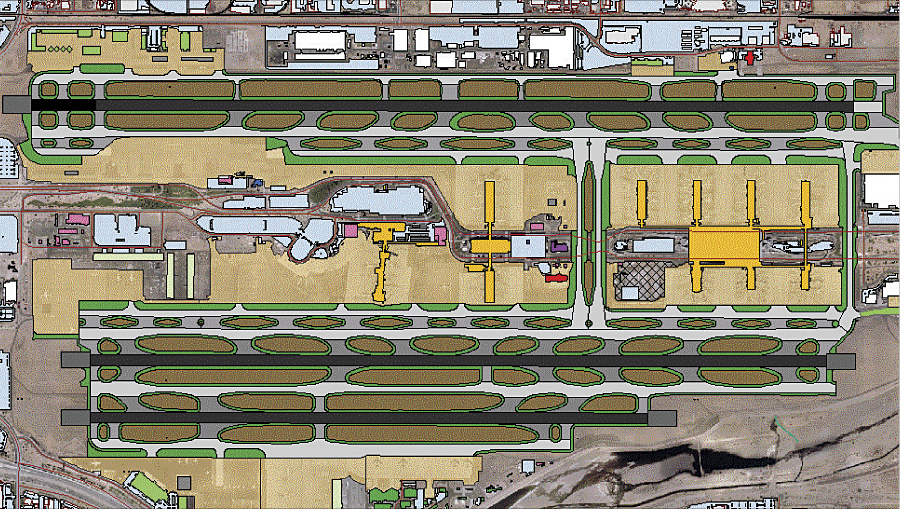
An aerial view of Sky Harbor Airport ( the thin red lines going through the terminals are the roadways I am focusing on )
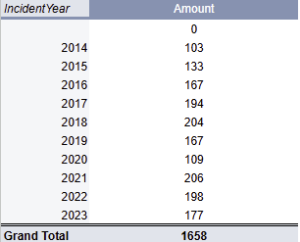
This week, I focused mainly on compiling data into my spreadsheets. The crash data I’m working with reveals trends over several years. For example, from 2014 to 2022, the number of crashes steadily increased, reaching 206 incidents in 2021. However, the crash amount has decreased the past two years, suggesting I need to look at any new changes that may explain the drop. ( The table is pictured below)
I’m excited to continue this work and see how the analysis can lead to practical solutions to improve safety and traffic management in this critical part of Phoenix’s transportation network.
Worked Cited:
[1] Table 1: Arizona Department of Transportation
Comments:
All viewpoints are welcome but profane, threatening, disrespectful, or harassing comments will not be tolerated and are subject to moderation up to, and including, full deletion.