Quantum Mishmash
Daniel j -
Creating weird shapes sounds fun. Until you have to code it.
This past week, I worked mostly to further develop the code that I had started writing in the prior week. There were three main geometries that I had to work on—the quantum point contact (QPC), the quantum dot, and the one-sided quantum dot.
These three geometries are mainly based on the idea of a split gate, which is basically branches of high potential on a 2D electron gas plane (which is basically where potential equals zero, allowing free conductance) that only allow electrons to pass through a narrow space between them. And because the minuscule size of this gap is comparable to that of the wavelength of the electron, the particle primarily exhibits ballistic behavior (as if it were a particle) instead of that of a wave, which causes significantly less scattering and allows for the conductance quantization that I mentioned in last week’s blog.
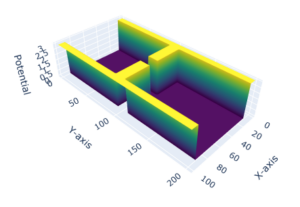
As I learned about each of these geometries, I began creating the base for each of the geometries, placing default values as placeholders for the inputs. This part was easy enough, as it was simply plotting z-axis/potential values to the x-y coordinate plane to make sure certain parts had a certain potential value while other parts did not. What I ended up with is the following:


Then came the more difficult part. Users had to be able to change these geometries according to what type of device they wanted to create. For example, if they wanted to increase the size of the quantum point contact, they should be able to do that by simply inputting a value. And if they wanted to change the potential value, they should be able to do that as well. And each time they do change something, the entire figure should update.
After struggling with the code for hours, I finally arrived at the following product:


This UI allows users to select different geometries, adjust the size of every aspect of the graph, and adjust the mesh size of the entire graph as well. For example, say the user wanted to create a split gate quantum contact point where the QPC gap is 20 units wide and 30 units long, while keeping the potential value at 4 units. They would choose “Quantum Point Contact” from the “Type” dropdown box and input 20, 30, and 4 for QPC Gap, QPC Length, and Vdiag Value, respectively. Once they hit “Generate Plot,” the following would appear:

As you can see, this figure is subtly different from the original quantum point contact figure, the gap being wider and longer, and the potential being higher.
Similarly, if you were to input “Quantum Dot,” QPC Gap: “20,” QPC Length: “10,” Vdiag Value: “3,” Num Dots (This one is special for quantum dots as this input decides how many of the areas bounded by quantum point contacts you want): “2,” and mesh size as X: 100 by Y: 300, you would get the following:

In this way, I tried to make the output as flexible as possible so that it accounts for any type of change for all three of these geometries.
Now, it looks like the input part of the GUI is done. But that’s just half the battle. What I have to do now (and for the following week) is work with the outputs, which are the energy vs. transmission plots as well as the electron density plots that use the Usuki calculations.
Well, it looks like I have to get coding! See you next time!
Comments:
All viewpoints are welcome but profane, threatening, disrespectful, or harassing comments will not be tolerated and are subject to moderation up to, and including, full deletion.