Week 6: Looking at the Whole City + Poverty Rates
Joplin C -
Welcome back everyone!
I hope you all had a wonderful spring break! Y’all deserve it for all of your hard work throughout the year! And speaking of year… I can’t believe the year is almost over! However, that also means that we have reached the halfway mark of my project.
Many of the maps I have made so far offer some pretty eye-catching discoveries, and I wish to incorporate all of them into my final presentation. One discovery that I made was how stark the relationship was between poverty rates (blue) and heat-related deaths (red) by zip code.
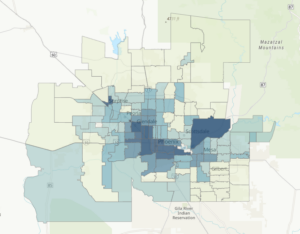
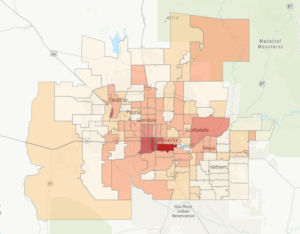
Those maps look almost identical, right? Unfortunately, this correlation did not occur by happenstance. Lower income households disproportionately suffer from poorly insulated housing and a lack of access to cooling resources such as indoor recreation and tree cover. Also, there frequently tends to be a high reliance on public transportation in these areas. This makes vulnerability to heat-related illness closely tied with how much people make, which also makes this issue one tied with inequality. As I go forward, I look to see which other factors also have such a strong correlation and compare their relationships with each other.
If you hadn’t noticed already, I also added in additional zip codes to the maps that cover the entire Phoenix Metro Area in addition to just the city of Phoenix. This will give me more data to analyze, which will help reduce error/bias, and make visualizations easier for a reader. Now, all of this extra data did come with some challenges.
First, some zip codes were missing from the 2020 Census or were military bases/post offices. For this reason, I had to exclude them, such as 85288, in Tempe.
Second, I learned from my expert advisor that depending on how the data is represented, the maps can look very different. For example, in areas where homelessness is prevalent, it is difficult to assign locations to deaths, and it can be impossible to determine a definite zip code. For this reason, many heat-deaths do not have a zip code assigned to them. Another example is the difference between indoor heat deaths and outdoor heat deaths. These deaths often cluster in different parts of the city, and each type of death brings its own set of unique vulnerabilities.
I have gained so much insight since I first began, and I wish I could share so much more. However, to keep things concise, that is all I have for now. Once again, welcome back, and I will see you all next week!
Joplin Chambers
(n.d.). Maricopa County Public Health Heat Related Deaths Dashboard [Review of Maricopa County Public Health Heat Related Deaths
Dashboard]. https://app.powerbigov.us/view?r=eyJrIjoiZDA3ZTUzNzAtMzIwMS00YzA3LTlhMzEtZmJhZGQzY2FlYmZlIiwidCI6IjMwY2QzNWQ0LTk5NTEtNGE3Mi05NzhlLTg5NjU1MDc1YzE3ZiJ9
States, U. (2024). Explore Census Data.
Census.gov. https://data.census.gov/table/ACSST1Y2023.S1701?q=poverty
Comments:
All viewpoints are welcome but profane, threatening, disrespectful, or harassing comments will not be tolerated and are subject to moderation up to, and including, full deletion.