Week 8: Scaling and FFTs
Shaima U -
Hi all, it’s been quite a week since I got the stir bars last time. I’ve progressed in the sense that I’ve collected some data, but I’ve been trying to scale down the reaction even more. The first couple trials of this have been quite inconsistent. I haven’t been getting successive oscillations, the blue starch-triiodide complex has been really pale, and at times, I run out of one solution before the others (there should be an equal ratio of all solutions…). I originally started off my journey by making a total solution (A+B+C) of 30ml , but I tried scaling it down by a factor of 5 to a total of 6ml. This is important because I don’t want to use too much of my deuterated materials aimlessly in one go, so the less materials I can use, the better. All hope isn’t lost, however. Last week, I scaled the reaction down by half, and I was able to get pretty consistent results! I created a Fast Fourier Transform (FFT) which gives insight into what frequencies are most apparent throughout each plots’ oscillations:
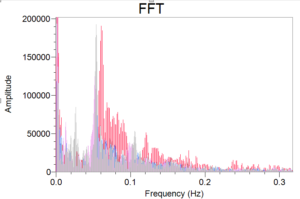
We can see a great peak between 0.15-0.17 Hz. I’ll be using this plot again when I collect data from my deuterated trials. I can’t say I know what will happen, though, because I can make an argument in the case that there is a slight or great change in frequency. I don’t expect absolutely no change, but we’ll see what happens when I get there (hopefully by later this week!).
Separately, I’ve also been working on a method for analysis based partly on theory. A previous study on the sibling reaction of BR, the Belosouv Zhabotinsky (BZ) reaction, has been done under deuterated acidic conditions as well. In the paper, they had developed a means to find the rate constant, k1, of their enolization reaction through theory given their specific experimental conditions. Through this, they were able to find that the enolization reaction actually demonstrated a primary KIE as opposed to the secondary KIE that extraneous research has demonstrated in the enolization reaction under similar acidic conditions (under sulfuric acid). Essentially, I’m hoping to proof this method of analysis by conducting it under the BR reaction, and we’ll see what happens from there!
Comments:
All viewpoints are welcome but profane, threatening, disrespectful, or harassing comments will not be tolerated and are subject to moderation up to, and including, full deletion.